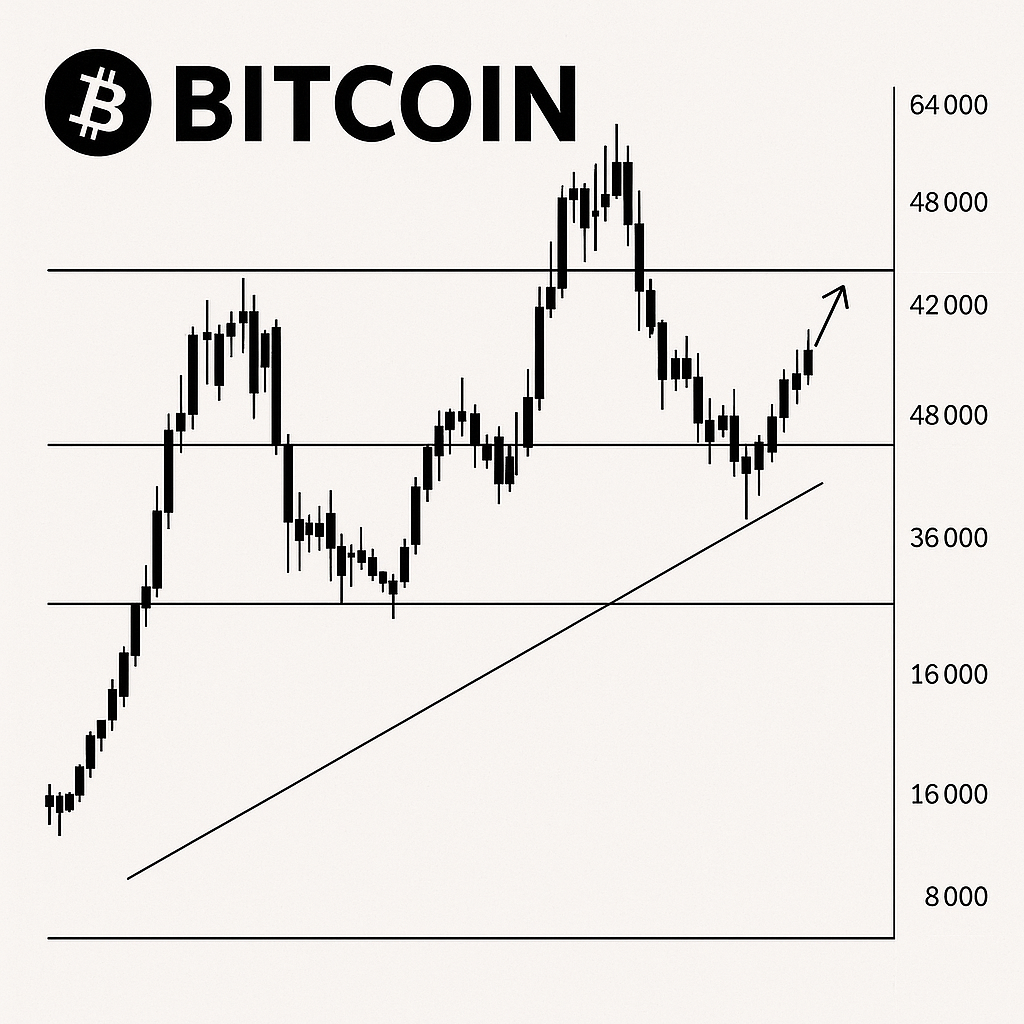
Bitcoin’s price action in 2025 is already captivating traders, with volatility surges and new all-time highs fueling both excitement and anxiety. But beneath the surface noise, seasoned analysts are laser-focused on two key technical tools: the SMA200 daily line and Fair Value Gaps (FVGs). These indicators are shaping the strategies of institutional desks and retail traders alike, offering a framework for navigating support, resistance, and potential pivots as the bull cycle matures.
Why the SMA200 Daily Line Matters in 2025
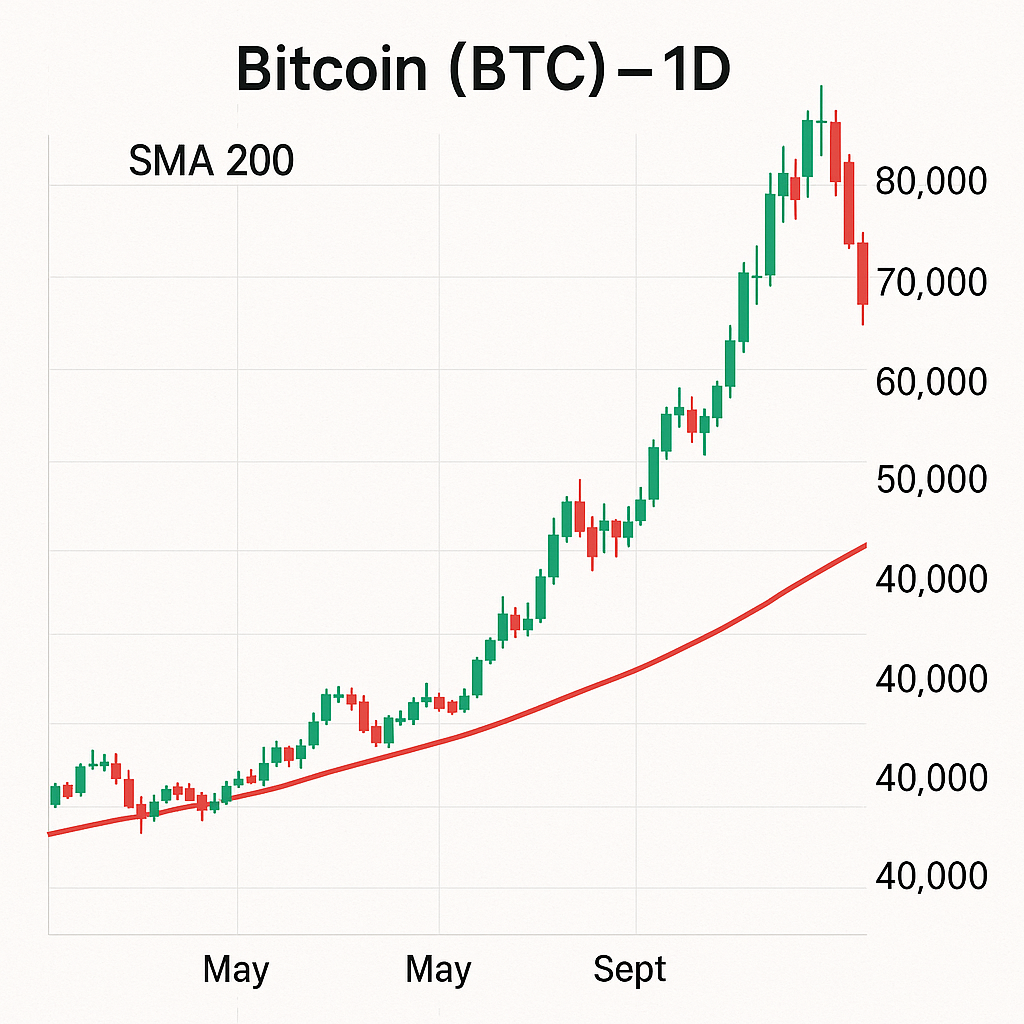
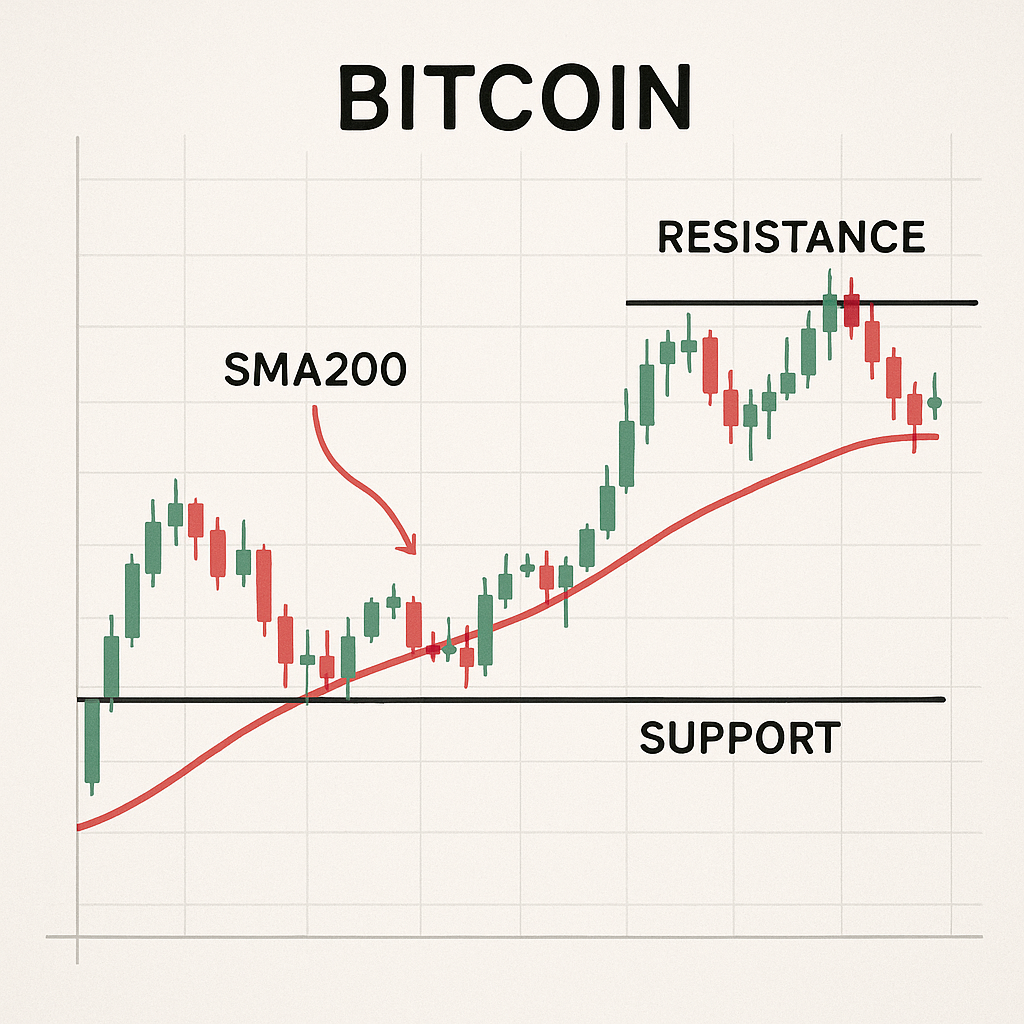
The Simple Moving Average (SMA) 200 is more than just a lagging indicator—it’s a psychological anchor for market participants. In previous cycles, the daily SMA200 has acted as an inflection point: a breakdown below signals bear territory, while reclaiming it often precedes parabolic rallies.
In 2025, with macro conditions shifting and Bitcoin’s correlation to traditional markets fluctuating, the SMA200 is again at center stage. As of this writing, Bitcoin’s price remains comfortably above its 200-day average—a classic sign of bullish momentum. However, historical backtests (see Quantified Strategies’ research) show that sharp retracements toward this level often provide high-probability entry points for disciplined investors.
Top BTC Technical Indicators Pro Traders Use in 2025
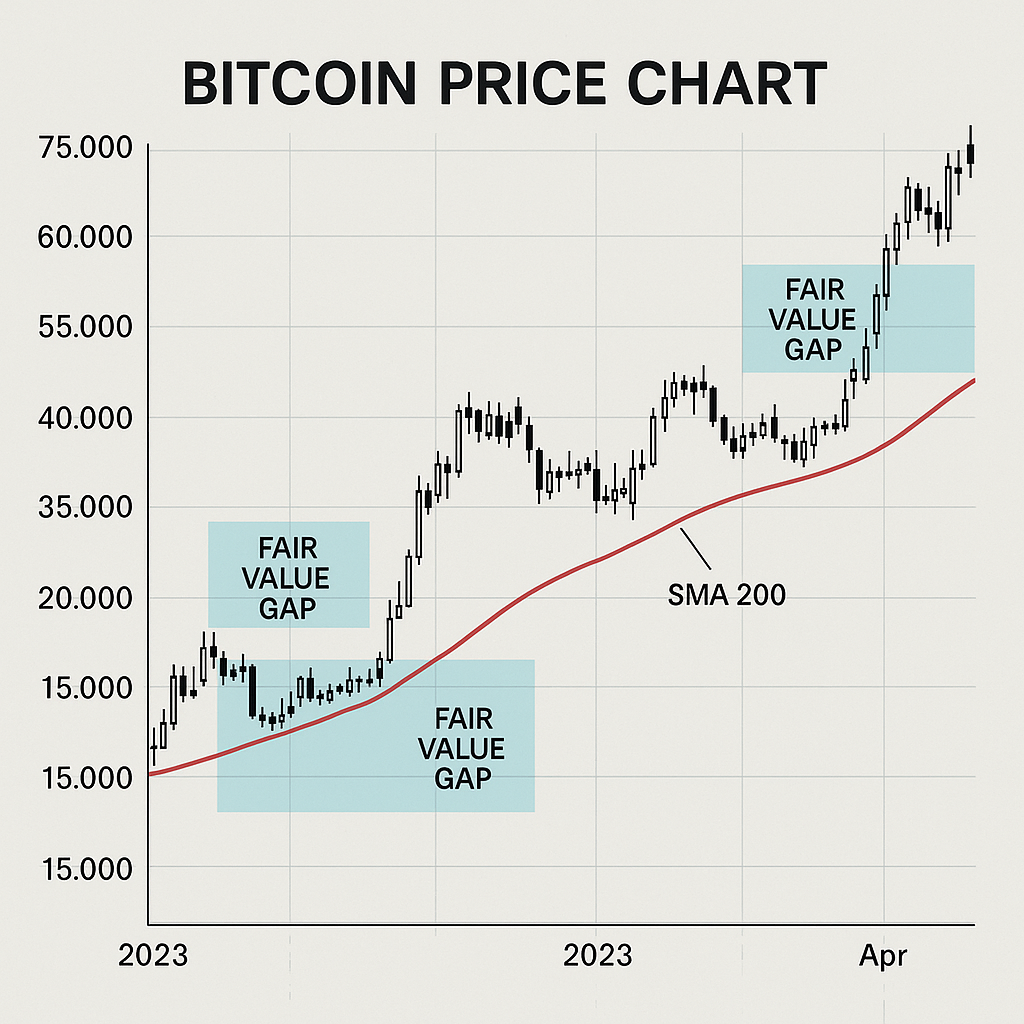
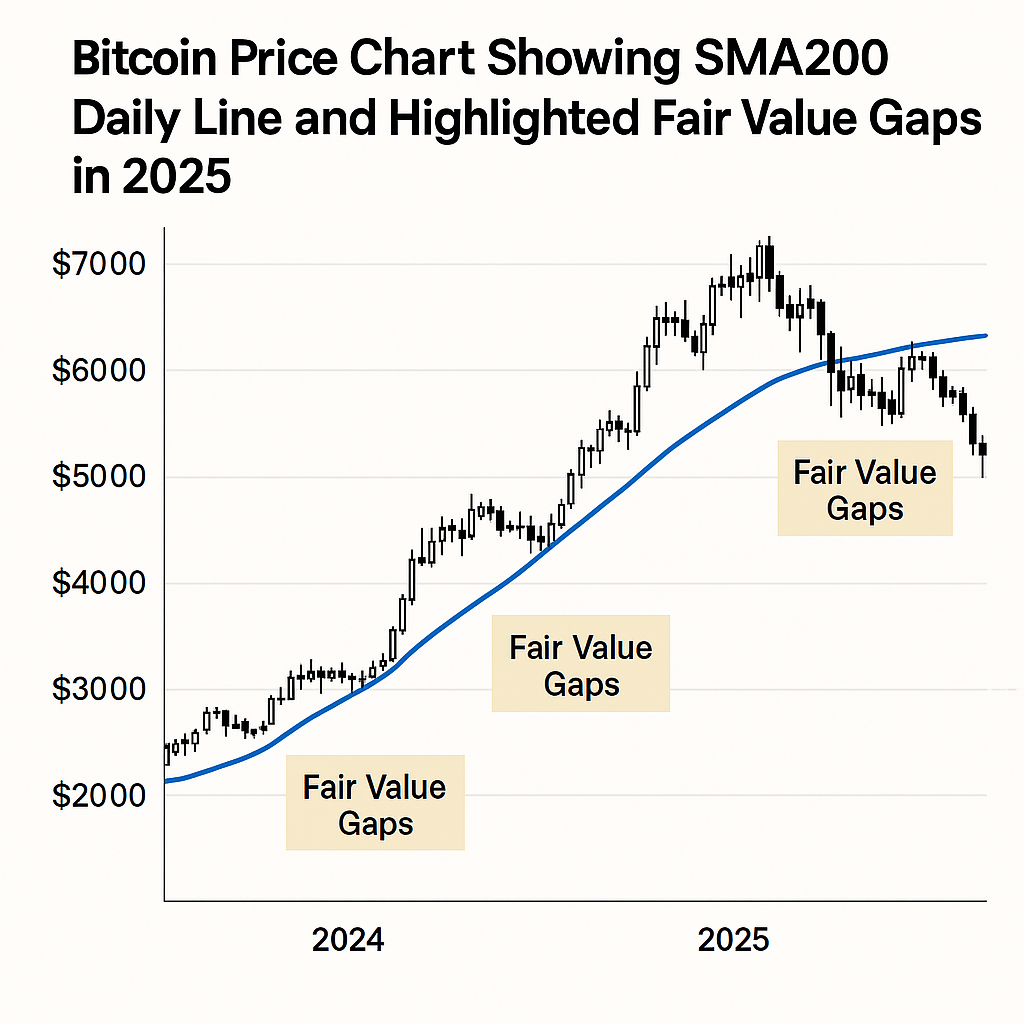
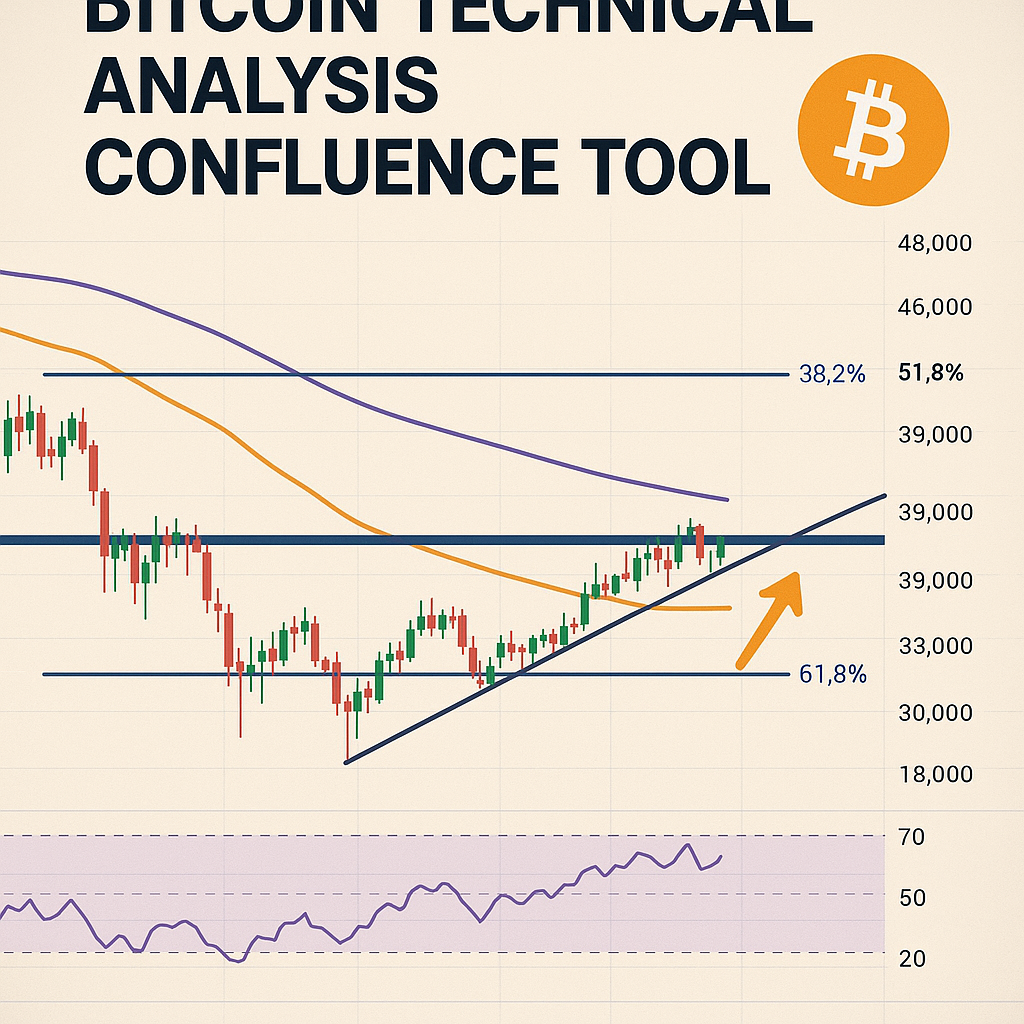
- SMA200 Daily Line: The Simple Moving Average (200-day) is a classic trend indicator. Pro traders monitor BTC price relative to the SMA200 to confirm long-term bullish or bearish momentum.
- Fair Value Gap (FVG): This identifies price imbalances on the chart. Pro traders use FVGs to anticipate where Bitcoin might retrace or accelerate, especially in high-volatility bull markets.
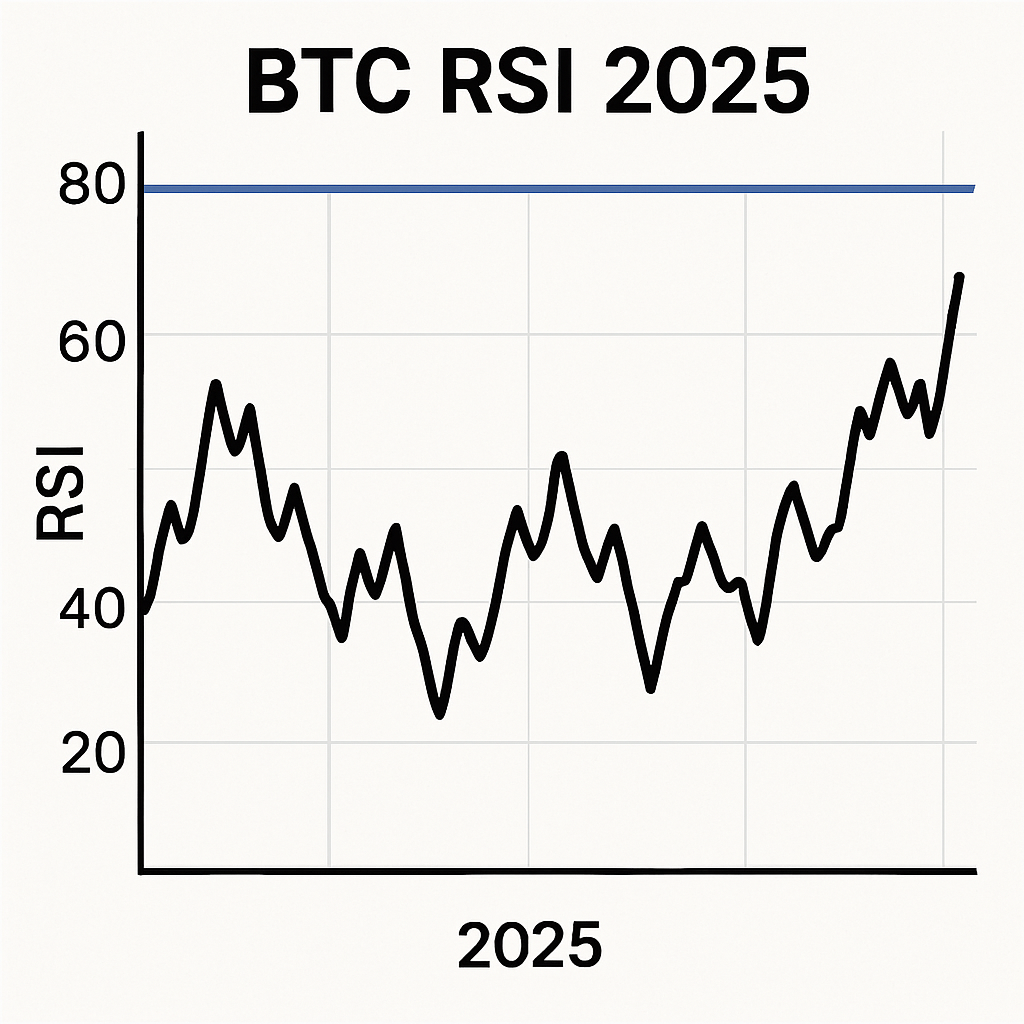
- Relative Strength Index (RSI): RSI measures the speed and change of price movements. In 2025, traders use it to spot overbought or oversold BTC conditions for timing entries and exits.
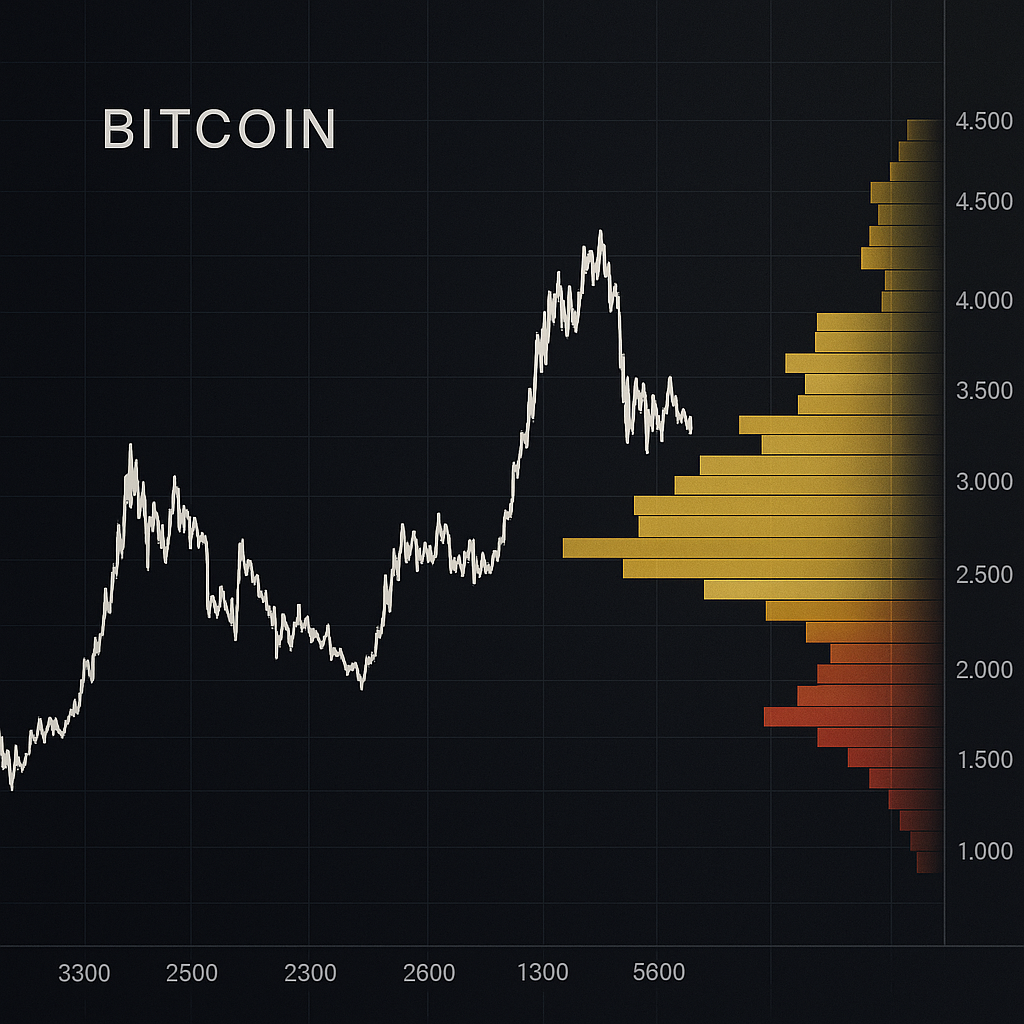
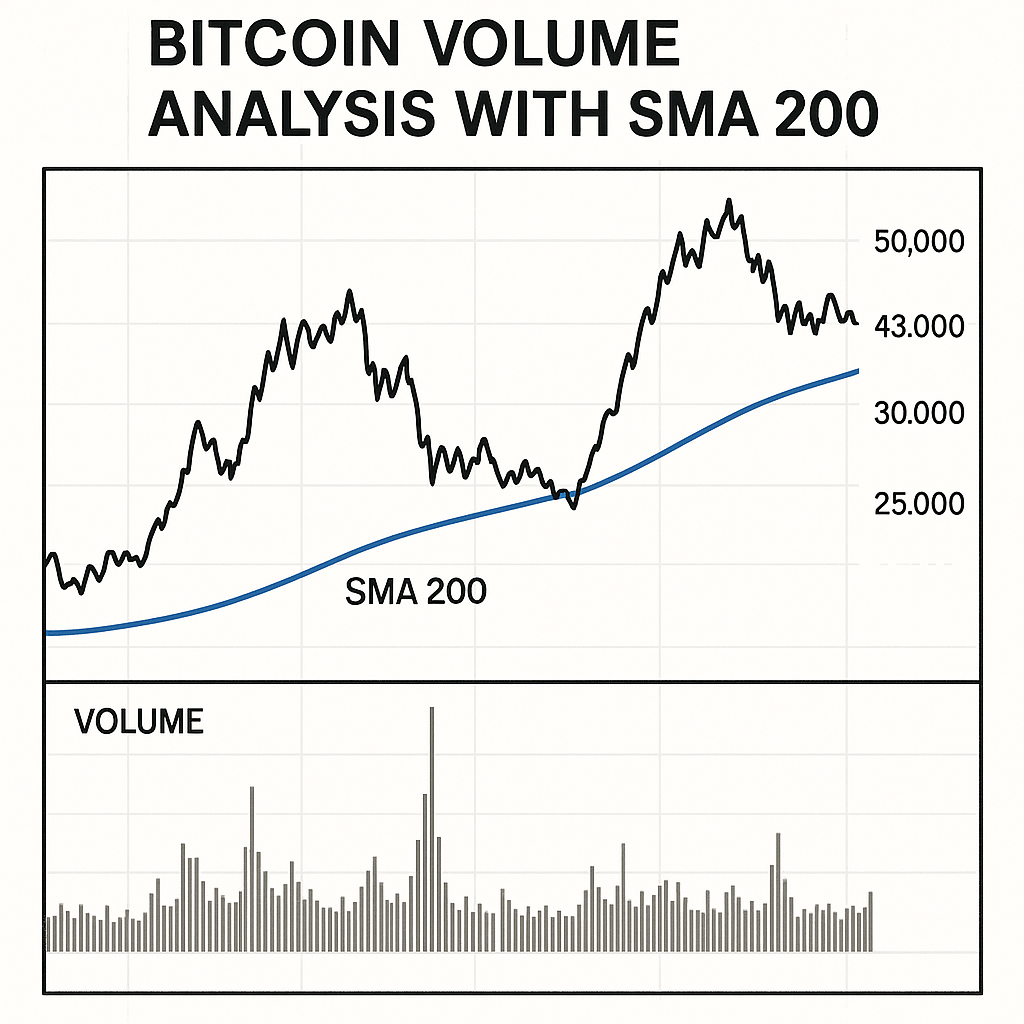
- Volume Profile: This tool shows traded volume at each price level. Pro traders analyze volume clusters to find support and resistance zones during Bitcoin's bull runs.
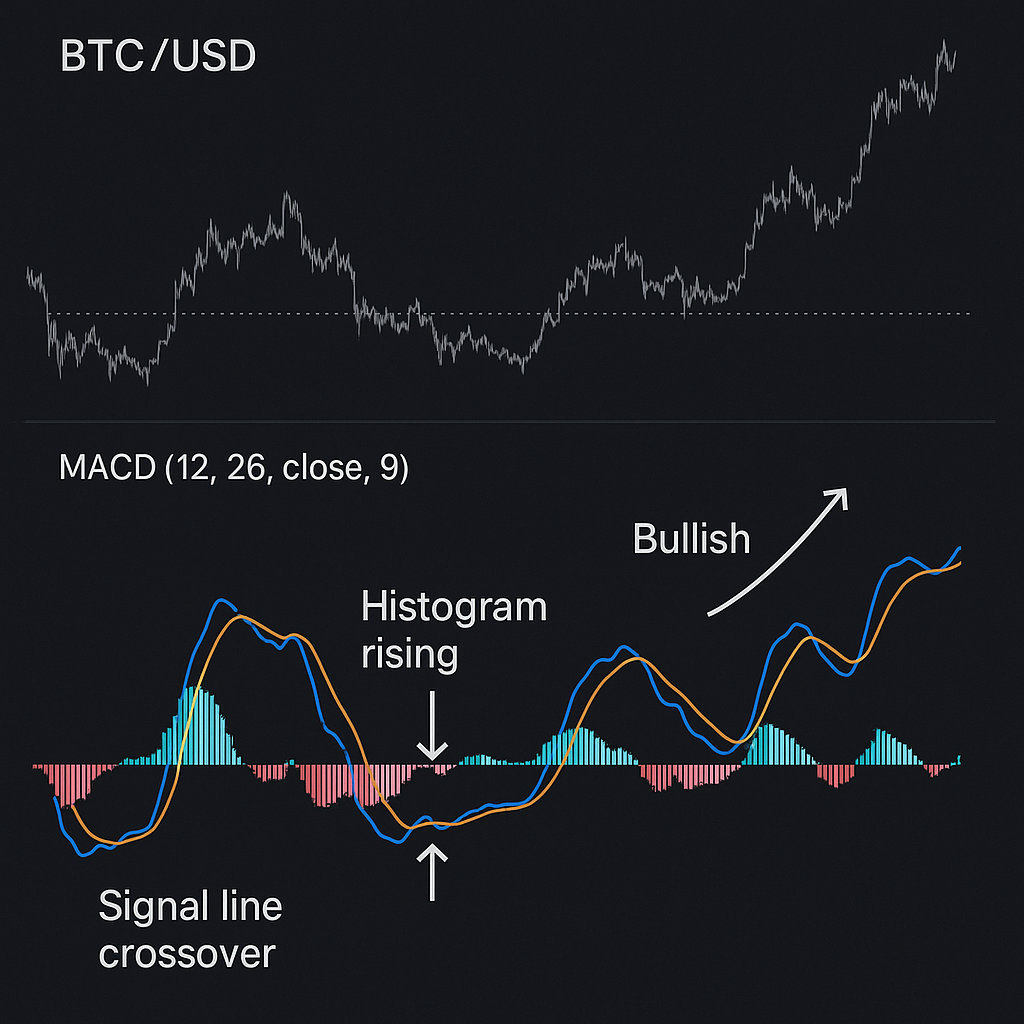
- MACD (Moving Average Convergence Divergence): MACD tracks trend strength and momentum. It helps traders spot bullish or bearish crossovers and divergences in BTC price action.
What makes this moving average so reliable? It smooths out short-term noise while reflecting long-term sentiment among whales and institutions. The SMA200 also serves as a dynamic support line—when price tests it from above during corrections, buy orders typically cluster there. In contrast, if Bitcoin closes below it on strong volume, it can ignite panic selling or algorithmic liquidations.
The Mechanics of Fair Value Gaps in Crypto Trading
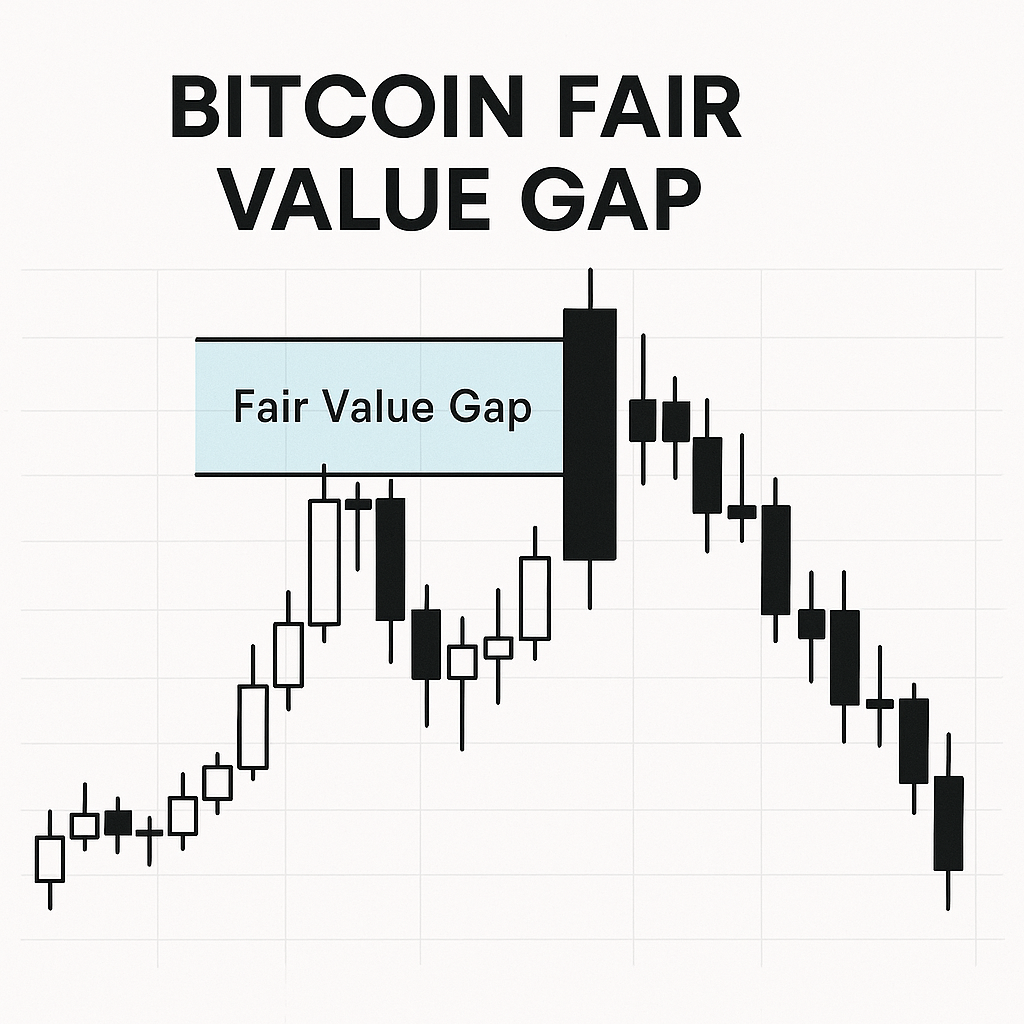
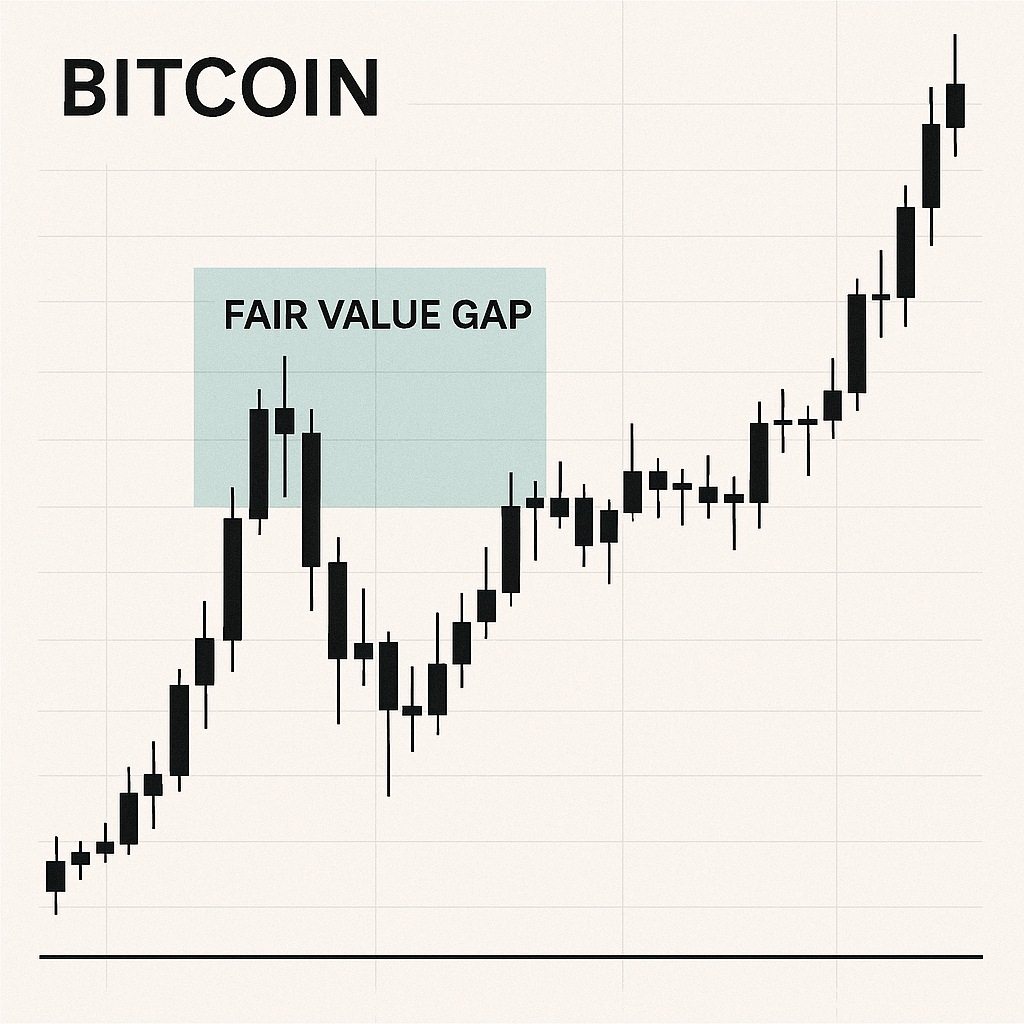
Fair Value Gaps (FVGs), popularized by “Smart Money Concepts,” highlight areas where buying and selling were out of balance—often after explosive moves up or down. On candlestick charts, these gaps appear when there’s little to no overlap between consecutive candles’ wicks or bodies. For Bitcoin traders in 2025, FVGs are more than curiosities—they’re actionable zones for anticipating reversals or continuations.
The rationale? When price leaves an FVG behind during a breakout or breakdown—think of those sudden $3K+ hourly candles—it signals that liquidity was thin and not all orders got filled at fair value. Markets tend to “retrace” into these gaps later as algorithms seek equilibrium.
- Bullish FVG: Price rockets upward; unfilled buy orders remain below; future dips may fill this gap before resuming higher.
- Bearish FVG: Price plunges; unfilled sell orders linger above; relief rallies may revisit the gap before further declines.
This concept aligns with recent social media sentiment:
Synthesizing SMA200 With Fair Value Gap Zones
The real power comes when you overlay these two tools. For instance: if Bitcoin approaches its daily SMA200 just as it enters a previously unfilled bullish FVG zone from earlier in the year, odds favor a strong bounce—especially if on-chain metrics show whale accumulation nearby. Conversely, if price slices through both an FVG and the SMA200 on heavy volume, it may signal deeper corrective risk ahead.
This dual-framework approach is gaining traction among algorithmic trading desks and retail strategists alike. It offers not just entry/exit triggers but also context for setting stop-losses or scaling into positions—a critical advantage given how quickly sentiment shifts in crypto bull markets.
If you’re building your toolkit for Bitcoin SMA200 daily analysis or want to master Fair Value Gap Bitcoin trading, understanding their interplay could be your edge in 2025’s volatile landscape.
As Bitcoin’s 2025 bull market narrative unfolds, traders are increasingly looking beyond the basics and integrating nuanced tools like the SMA200 daily line and Fair Value Gap (FVG) into their strategy. The interplay between these two technical indicators is shaping up to be a defining feature of advanced crypto trading—especially as volatility returns to the digital asset space.
SMA200: The Psychological and Technical Battleground
The SMA200 daily analysis isn’t just a statistical artifact—it’s a psychological anchor for both retail and institutional players. When Bitcoin’s price holds above this line, it signals sustained bullish sentiment. Conversely, dips below can trigger cascades of automated selling or “buy-the-dip” opportunities, depending on broader market context.
In 2025, we’re likely to see the SMA200 act as a dynamic support zone. Historically, significant pullbacks toward this level have been met with aggressive bids from long-term holders and algorithmic trading desks alike. This is especially true during bull markets when FOMO-driven inflows amplify every bounce above the 200-day average.
What’s crucial for traders is not just where price sits relative to the SMA200 but how it interacts with volume spikes and order book depth at that juncture. When large clusters of limit orders appear near the 200-day moving average, it often marks battle lines between bulls and bears. In these moments, monitoring on-chain activity—such as whale wallet movements—can provide an additional edge.
Fair Value Gap: Mapping Imbalances for Strategic Entries
The Fair Value Gap in Bitcoin trading is gaining traction among those who want to pinpoint supply-demand imbalances that aren’t immediately obvious from price alone. These gaps frequently emerge after sharp breakouts or breakdowns—when one side of the order book is momentarily overwhelmed—and often get “revisited” by price action before a new trend resumes.
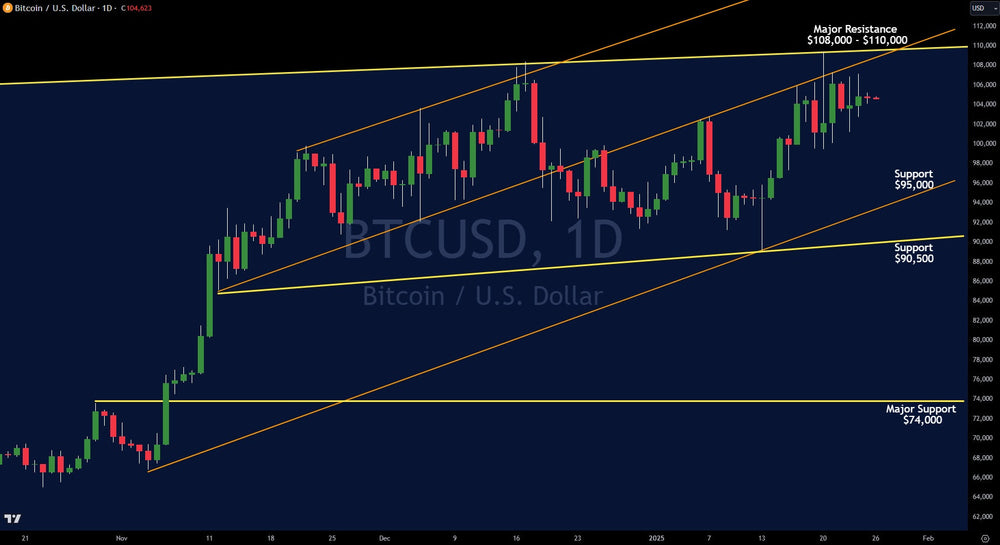
This year, traders are using FVG zones in tandem with classic support/resistance levels to refine their entries and exits. For example: if BTC surges through resistance but leaves an unfilled FVG below (say, between $80K-$82K), savvy participants may set limit buys within that range, anticipating a retracement before continuation higher.
This approach aligns with so-called “Smart Money Concepts,” where professionals fade retail euphoria by buying into fear-driven dips that coincide with both the SMA200 and prominent fair value gaps—a tactic often discussed on crypto Twitter and trading forums.
Tactical Checklist for BTC Technical Analysis in 2025
- Monitor daily closes relative to SMA200: Are we holding above or breaking down?
- Identify recent Fair Value Gaps: Mark areas left behind after impulsive moves. These can act as magnets for future price action.
- Cross-reference volume: High volume at an FVG or SMA200 touch increases reliability of reversal signals.
- Watch for confluence: When FVGs align with the SMA200 or established horizontal support/resistance zones, conviction increases.
- Diversify timeframes: Use four-hour charts alongside daily views to spot early momentum shifts.
The Road Ahead: Navigating Crypto Trading Strategies in Volatile Markets
Bull markets breed overconfidence—but they also reward those who combine technical rigor with adaptive risk management. The best BTC technical indicators for 2025 will likely be those that synthesize multi-layered data: not just moving averages or gaps alone, but also sentiment analysis (from sources like Twitter), on-chain flows, and macroeconomic catalysts such as ETF approvals or regulatory developments.
If you’re building your own crypto trading strategies this year, consider layering these tools rather than relying solely on lagging indicators. For instance, pairing a confirmed bounce off the SMA200 with an unfilled FVG from a prior breakout could yield asymmetric risk/reward setups—particularly if supported by rising open interest or bullish options flows.
Top Mistakes When Using SMA200 & Fair Value Gaps
- Ignoring Higher Timeframe Trends: Many traders focus solely on the SMA200 daily without considering the broader market structure, leading to false signals and poor entries.
- Misinterpreting Fair Value Gaps: Traders often mistake minor price imbalances for significant Fair Value Gaps, resulting in unreliable trade setups and unexpected reversals.
- Overreliance on SMA200 as Support/Resistance: Assuming the SMA200 will always act as a strong support or resistance can lead to losses, especially in volatile bull markets where price can pierce through levels.
- Neglecting Volume Confirmation: Failing to confirm SMA200 or Fair Value Gap reactions with volume analysis increases the risk of falling for fakeouts or weak moves.
- Entering Trades Without Confluence: Relying on a single indicator like SMA200 or Fair Value Gap without additional confirmation tools (e.g., RSI, MACD) often leads to low-probability trades.
The bottom line? While no single indicator guarantees success in crypto’s wild terrain, blending robust technical frameworks like the SMA200 daily analysis with emerging concepts such as fair value gap mapping puts you ahead of much of the market noise. Stay nimble—and don’t underestimate how quickly liquidity dynamics can shift around these key levels as we move deeper into 2025’s bull cycle.
No comments yet. Be the first to share your thoughts!